
Back to App
MCP App Area Beta

MCP Prompt Library

Copy-ready Claude prompts grouped by business subject area. Type a value in any header box — every other box with the same label on this page updates with it.

No client-specific starters. Enter your business name and any other header fields first, then click copy. The prompt updates before it goes on the clipboard.
Filter

Getting Started

Use these prompts to understand what Claude can access through Marquis IQ before asking for analysis.

Dataset Primer

Get a fast list of available datasets and what each one is for. No row samples and no SQL.

Use the Marquis IQ MCP server for this request. Give me a fast primer of the datasets available on this connection. For each dataset, show only: - Dataset name - A one-sentence summary of what it contains and when I would use it Rules: - Use dataset discovery / catalog metadata only. - Do not run SQL. - Do not query, preview, export, or sample any rows. - Do not list every field. - Keep the answer short so I can pick a dataset and ask a better question next.
Dataset Field Catalog

Generate a field catalog across available Marquis IQ MCP datasets.

Use the Marquis IQ MCP server for this request. List all available datasets and their fields. For each dataset, show: - Dataset name - View name - A one-sentence description of what it contains and what it is used for - A table of all fields with: - Column name - Data type - Brief description After the datasets, show: - A common join key reference table - A financial segment value reference table
Scope Check

Understand coverage before requesting detailed results.

Use the Marquis IQ MCP server for this request. Using Marquis IQ, summarize the data coverage for {SUBJECT_AREA}. Include: - ERP systems - Companies - Available date range - Main entities or transaction types - Any limitations I should know before asking for results

CRIT Method

Use the CRIT structure when you want Claude to clarify the business context before running analysis. It helps keep data requests focused and tied to a specific role, problem, and deliverable.

CRIT Analysis Request

Guided structure for business analysis prompts.

Use the Marquis IQ MCP server for this request. Use the CRIT method for this Marquis IQ analysis request. Context {CONTEXT} Role {ROLE} Interview Ask me up to 3 questions to clarify the request and keep you on target before running any queries. Task {TASK}

Sales Questions (CRIT Method)

Each prompt has fill-in boxes in its header. Type your values, then click copy. The highlighted placeholders in the prompt update as you type, and anything you leave blank stays as a placeholder so you can edit it in Claude.

Intercompany is excluded by default. Every sales prompt assumes intercompany sales are left out of the analysis. Use the Intercompany control in the header if you need to include them. Claude is also told to state this assumption in the answer.
Customer Volume Trend
Use before a customer call when you need to explain whether their spend is up or down, and what is driving it.

Where is this customer's volume up or down?

CONTEXT: I have access to {YOUR_BUSINESS_NAME}'s sales data via the Marquis IQ MCP server (customer, product category, warehouse, invoice date, net sales, gross margin). I want to understand volume trends for {CUSTOMER_NAME}. ROLE: You are a sales analyst who specializes in account-level trend analysis. INTERVIEW: Before pulling anything, ask me using tappable option buttons (not open text): 1. Time comparison - options: "This year vs last year", "Trailing 3 months", "Trailing 6 months", "Trailing 12 months" 2. Breakdown - options: "Account total only", "By product category", "By warehouse", "By rep" TASK: Once I've answered, pull sales and margin for that customer over the comparison periods, flag the categories or segments driving the biggest swings (up and down), and give me a short summary I can use in a customer conversation.
Attrition
Use when you want a call list of accounts that have gone quiet or dropped off, for a rep, a territory, or the whole book.

Where are we seeing attrition?

CONTEXT: I have access to {YOUR_BUSINESS_NAME}'s sales data via the Marquis IQ MCP server. "Attrition" here means customers who used to buy from us and have gone quiet or dropped off. Scope: {SCOPE}. ROLE: You are a sales analyst focused on churn and retention signals. INTERVIEW: Before pulling anything, ask me using tappable option buttons (not open text): 1. "Gone quiet" definition - options: "No purchases in 60 days", "No purchases in 90 days", "No purchases in 180 days", "Revenue drop vs. their own average" 2. Ranking - options: "Biggest dollar accounts at risk", "Biggest percentage drop-off" TASK: Once I've answered, identify customers matching that definition, rank them, and show their prior run-rate vs. current activity so I can see the size of what's at risk.
Stopped Buying
Use when a customer still buys from you, but you suspect they quietly dropped certain products or categories.

What products have they stopped buying from us?

CONTEXT: I have access to {YOUR_BUSINESS_NAME}'s sales data via the Marquis IQ MCP server, broken down by customer and product category/SKU. I want to see what {CUSTOMER_NAME} has stopped buying from us. ROLE: You are a sales analyst focused on product-level purchase gaps. INTERVIEW: Before pulling anything, ask me using tappable option buttons (not open text): 1. "Stopped buying" window - options: "Nothing in last 3 months", "Nothing in last 6 months", "Nothing in last 12 months" 2. Scope - options: "Only meaningful dollar categories", "Every category/SKU, no matter how small" TASK: Once I've answered, list the products/categories that dropped off, show what they used to spend on each, and flag which of those look like the biggest reactivation opportunities.
Similar Customer Gaps
Use when you want cross-sell ideas for one account based on what peer customers buy that they do not.

What are similar customers buying that this customer isn't?

CONTEXT: I have access to {YOUR_BUSINESS_NAME}'s sales data via the Marquis IQ MCP server, including customer segment/pricing group, region, and product category purchase history. The target customer is {CUSTOMER_NAME}. ROLE: You are a sales analyst who specializes in whitespace and peer comparison analysis. INTERVIEW: Before pulling anything, ask me using tappable option buttons (not open text): 1. "Similar" definition - options: "Same industry/segment", "Same region", "Similar revenue size", "I'll name specific peer accounts" 2. Output format - options: "Ranked list of missing categories", "Grouped by how many peers buy it" TASK: Once I've answered, build a peer group matching that definition, compare their category-level purchases to the target customer, and rank the gaps by how common they are among peers and how much revenue they typically represent.
Whitespace Opportunities
Use when you need a ranked growth list across an account, a rep book, or a territory rather than one customer.

Where are the biggest whitespace opportunities?

CONTEXT: I have access to {YOUR_BUSINESS_NAME}'s sales data via the Marquis IQ MCP server across customers, product categories, and time periods. Scope: {SCOPE}. ROLE: You are a sales analyst focused on whitespace and account growth opportunities. INTERVIEW: Before pulling anything, ask me using tappable option buttons (not open text): 1. Whitespace definition - options: "Categories never bought", "Categories bought before, stopped", "Below what similar customers spend" 2. Ranking - options: "Biggest dollar opportunity", "Easiest/most likely to close" TASK: Once I've answered, identify and rank the top whitespace opportunities against that definition, and give me the dollar size of each so I can prioritize.
Purchase Behavior Change
Use when something feels off in order frequency, order size, product mix, or margin, and you want to see what actually changed.

What has changed in their purchasing behavior over the last 3, 6, or 12 months?

CONTEXT: I have access to {YOUR_BUSINESS_NAME}'s sales data via the Marquis IQ MCP server, with invoice-level detail by customer, product category, and date. I want to look at {CUSTOMER_NAME}. ROLE: You are a sales analyst focused on behavior-change detection. INTERVIEW: Before pulling anything, ask me using tappable option buttons (not open text): 1. Window - options: "Last 3 months", "Last 6 months", "Last 12 months", "Compare all three side by side" 2. "Changed" means - options: "Order frequency", "Average order size", "Product mix shift", "Margin shift", "All of the above" TASK: Once I've answered, pull the relevant metrics for each window, highlight what's meaningfully different from their prior baseline (not just noise), and summarize the 2-3 most notable behavior shifts.
Three Conversation Opportunities
Use when you are walking into a meeting and need three data-backed talking points fast.

What are the three best opportunities I should discuss with this customer today?

CONTEXT: I have access to {YOUR_BUSINESS_NAME}'s sales data via the Marquis IQ MCP server: sales, margin, product category, and purchase history by customer. The customer is {CUSTOMER_NAME} and the conversation is happening {WHEN} (e.g. today, this week). ROLE: You are a sales strategist prepping a rep for a same-day customer conversation. INTERVIEW: Before pulling anything, ask me using tappable option buttons (not open text): 1. Conversation context - options: "Renewal", "Routine check-in", "Responding to a complaint", "Cold outreach" 2. Weighting - options: "Quick wins likely to close fast", "Biggest dollar opportunities, even long-term" TASK: Once I've answered, pull recent trends, whitespace, and attrition risk for this customer, then give me exactly three opportunities ranked by priority - each with the data point that supports it and a one-line reason it's worth raising today.
Customer Spotlight Artifact
Use before a customer meeting when you want one interactive, reusable briefing with trends, gaps, alerts, and recently impacted parts or services.

Create a high-level, re-runnable Customer Spotlight tool for meeting preparation.

CONTEXT: I have access to {YOUR_BUSINESS_NAME}'s sales data through the Marquis IQ MCP server. I need a reusable Customer Spotlight artifact for {CUSTOMER_NAME} that gives a salesperson everything important to review before a meeting without overwhelming them with detail. ROLE: You are a sales analyst and dashboard designer who specializes in concise, actionable customer briefings. INTERVIEW: Before pulling data or building the artifact, ask me using tappable option buttons (not open text): 1. Default comparison - options: "This year vs last year", "Trailing 3 months vs prior 3", "Trailing 6 months vs prior 6", "Trailing 12 months vs prior 12" 2. Meeting focus - options: "Growth opportunities", "Retention risk", "Margin", "Full account review" 3. Detail emphasis - options: "Parts and services", "Product categories", "Locations or warehouses", "Balanced view" TASK: Once I've answered, use the Marquis IQ MCP server to build an interactive Customer Spotlight artifact for this customer. The artifact must include: - Customer name, selected period, comparison period, last refresh date, and any important data-coverage limitations - Date selectors with useful presets and a custom start/end date option - High-level KPI cards for net sales, gross margin dollars, gross margin percent, order or invoice count, average order value, and last purchase date when available - Sales and margin trends over time with comparison-period context - Clear indicators for improving, declining, and unchanged performance - Recent alerts for meaningful changes in sales, margin, order frequency, average order size, or product mix - Attrition signals, stopped-buying categories, and reactivation opportunities - Whitespace or cross-sell gaps based on relevant peer customers when the available data supports a defensible comparison - Recently impacted parts and services, including the specific items or categories driving recent gains, declines, margin changes, gaps, or alerts - A concise "What to discuss" section with the three most important meeting talking points and the data behind each one - Drill-down tables for supporting detail without making the landing view too dense INTERACTIVITY: - Let the user change the date range and comparison period - Let the user filter by product category, part or service, warehouse or location, and sales rep when those fields are available - Make charts and KPI cards cross-filter the supporting details where practical - Include tooltips that explain each metric and alert - Include Reset Filters and Export Current View to CSV actions - Keep the first screen executive-friendly and put detailed records behind expandable sections or tabs RE-RUNNABLE DESIGN: - Build the artifact so the same structure can be refreshed for a different customer or date range - Preserve the Marquis IQ query assumptions and mappings needed to reproduce the results - If the artifact environment supports live connector refresh, include a Refresh Data action; otherwise clearly state that rerunning this prompt refreshes the artifact from Marquis IQ - Do not hard-code sample values as if they were live results - Use only fields and metrics confirmed to be available; label unavailable sections rather than inventing data DELIVERABLE: - Provide a polished, responsive, self-contained interactive HTML artifact - Use accessible colors, readable labels, and a layout suitable for desktop meeting preparation - Validate totals and comparison calculations before delivery - End with a short note describing how to rerun or refresh the Customer Spotlight for the next meeting.

Inventory

On Hand by Company and Tier

Summarize on-hand inventory by common planning dimensions.

Use the Marquis IQ MCP server for this request. Using Marquis IQ inventory data, show my on-hand inventory broken out by {BREAKDOWN_DIMENSIONS} for {SCENARIO}. Limit to company {COMPANY} and warehouse {WAREHOUSE}. Include: - On-hand quantity - On-hand value - Part count - Any available days-on-hand or turns metric Sort by on-hand value descending.
Part Cost History

Review long-term cost movement for a part.

Use the Marquis IQ MCP server for this request. Using Marquis IQ Unit Cost Fact or purchasing data, show me the cost history for part {PART_NUMBER} at company {COMPANY} for {DATE_RANGE}. Include: - Part number - Part description - Company - Warehouse or purchasing location, if available - Supplier, if available - Transaction date or effective date - Unit cost - Currency - Quantity, if available - Source document or transaction type, if available Show the results as both a table and a trend summary.
On Hand Trend by Part

Trend on-hand inventory for a specific part and warehouse.

Use the Marquis IQ MCP server for this request. Using Marquis IQ inventory data, show me the on-hand trend for part {PART_NUMBER} at warehouse {WAREHOUSE} over {DATE_RANGE}. Include: - Month - On-hand quantity - On-hand value - Receipts, if available - Issues or consumption, if available - Notable spikes or drops Summarize what changed and call out any unusual movement.
Create Inventory Dashboard

Build an interactive inventory planning dashboard from the Marquis IQ MCP inventory planning dataset.

Use the Marquis IQ MCP server for this request. Build an interactive Cowork artifact dashboard from the Marquis IQ MCP connector, Inventory Planning dataset (mcp-inventory-planning). SCOPE - Scenario: filter to exactly one ScenarioName. Use {SCENARIO} unless I change it. - Include a part if: [On Hand $] > 0 OR QuantityConsumedLTM > 0 Edit this scope if needed. For example, drop the consumption clause to only show currently-stocked parts, or swap in a different activity column such as ForecastedDemandQty or NetRequirements. BREAK DOWN BY - Company - Warehouse - Tier Other useful dimensions in the dataset may include: - TierType - MainCategory - PrimaryVendorName - AbcCode - BuyerPlannerName - InferredLifecyclePhase - WarehouseType METRICS - On-Hand $: SUM of [On Hand $]. This is safe to sum directly. - Turns $: IMPORTANT: the Turns and Turns$ columns are per-item ratios, not additive dollar figures. They are numerically identical to each other, just formatted differently. Never SUM(Turns$) across rows. Always compute a dollar-weighted average: SUM([On Hand $] * Turns) / SUM([On Hand $]) per group. Label it "Turns $" to match the dataset naming. - Add or remove other metrics as wanted, such as DOH, SafetyStockQuantity, Rec ROP, Rec EOQ, ServiceLevel, etc. DATA PULL - Explore the schema first if any column names are unfamiliar. - For aggregated views, use SQL-style grouped queries when available so row counts stay small. - For item-level detail, remember that exports may only support AND filters. If you need an OR condition like the scope above, run two filtered pulls and merge plus de-dupe locally, for example on Company + Warehouse + UniqueItemNumber, rather than trying to express OR in one export call. - Sanity-check that dollar totals from the item-level pull reconcile with the aggregated totals before building anything. DASHBOARD REQUIREMENTS - KPI tiles at the top, including total value, weighted turns, part count, and other relevant metrics. - Filter controls for each breakdown dimension. Use a segmented control for low-cardinality fields like Company, dropdowns for the rest, plus a free-text search box. - A primary chart, such as a stacked bar of the top metric by the main dimension segmented by a second dimension, that is clickable and cross-filters everything below it. - A sortable, filterable parts list. - An Export CSV button that exports whatever is currently filtered and sorted, not just the visible page, as a client-side download with no server round trip. - Flag anything notable at a glance, such as zero on-hand, overstock risk, understock risk, unusual usage, or policy exceptions. DESIGN - Use a clean data visualization style: ordinal or categorical color ramp, thin marks, hover tooltips, legend, recessive gridlines, and dark-mode-friendly variables. - Make it a self-contained single HTML file with inline CSS and JavaScript. Do not use external network calls. VERIFY BEFORE DELIVERING - Render the HTML and check for console errors. - Confirm KPI totals match a manual aggregate check. - Click through at least one filter. - Confirm the CSV export row count matches the on-screen filtered count. DELIVER - Provide the completed HTML file. - If artifact publishing is available in the current Claude session, save the dashboard as a named Cowork artifact so it can be reopened later.
Inventory Risk

Find items that may need planning attention.

Use the Marquis IQ MCP server for this request. Using Marquis IQ inventory data, identify items with inventory risk for company {COMPANY}, ERP system {ERP_SYSTEM}, item category {ITEM_CATEGORY}, and date range {DATE_RANGE}. Include: - Item number - Item description - Company - ERP system - On-hand quantity - Available quantity - Days on hand - Recent usage or demand - Exception or risk indicator, if available Group results by company and ERP system. Sort the highest-risk items first.
Overstock Review

Look for excess inventory candidates.

Use the Marquis IQ MCP server for this request. Using Marquis IQ inventory data, identify potential overstock items for company {COMPANY}, ERP system {ERP_SYSTEM}, and date range {DATE_RANGE}. Focus on items with inventory value at or above {MINIMUM_INVENTORY_VALUE}. Include: - Item number - Item description - Company - ERP system - On-hand quantity - Inventory value - Days on hand - Recent usage or demand - Recommended action, if supported by the available data
Inventory Movement

Summarize usage trends for items or categories.

Use the Marquis IQ MCP server for this request. Using Marquis IQ inventory data, summarize inventory movement for {ITEM_OR_CATEGORY} at company {COMPANY} over {DATE_RANGE}. Show: - Beginning quantity, if available - Ending quantity, if available - Receipts - Issues or consumption - Net movement - Notable spikes or drops Group by month.

Accounts Receivable

Open AR Aging

Summarize unpaid receivables.

Use the Marquis IQ MCP server for this request. Using Marquis IQ accounts receivable data, summarize open receivables as of {AS_OF_DATE} for company {COMPANY} and customer {CUSTOMER_NAME}. Group by: - Customer - Company Show: - Total open amount - Invoice count - Oldest invoice date - Aging bucket - Top customers by open amount
Customer Invoice Detail

Review invoice activity for a customer.

Use the Marquis IQ MCP server for this request. Using Marquis IQ accounts receivable data, show invoices for {CUSTOMER_NAME} during {DATE_RANGE}. Include: - Customer - Invoice number - Invoice date - Due date - Company - ERP system - Invoice amount - Open amount - Payment status Sort by invoice date descending.

Accounts Payable

Invoice Transactions CSV

Build a CSV-ready invoice transaction extract.

Use the Marquis IQ MCP server for this request. Using Marquis IQ invoice transaction data, build me a CSV download of {INVOICE_TYPE} for {DATE_RANGE} and company {COMPANY}. Include: - Invoice number - Invoice date - Supplier or customer, depending on the invoice dataset - Company - ERP system - Invoice amount - Currency - Status - Payment or open amount fields, if available - Any available PO, order, or source document reference Return the results in a CSV-ready table and include a brief summary of row count and total invoice amount.
Open AP Exposure

Summarize unpaid payables.

Use the Marquis IQ MCP server for this request. Using Marquis IQ accounts payable data, summarize open AP invoices as of {AS_OF_DATE} for company {COMPANY} and supplier {SUPPLIER}. Group by: - Supplier - Company Show: - Total open amount - Invoice count - Oldest invoice date - Aging bucket - Top suppliers by open amount
AP Invoice Detail

Review AP invoice activity for a supplier.

Use the Marquis IQ MCP server for this request. Using Marquis IQ AP invoice data, show invoices for {SUPPLIER} during {DATE_RANGE}. Include: - Invoice number - Invoice date - Due date - Company - ERP system - Invoice amount - Currency - Payment status - Any available PO reference Sort by invoice date descending.
Payment Term Review

Look for payment term or timing patterns.

Use the Marquis IQ MCP server for this request. Using Marquis IQ accounts payable data, summarize payment timing and payment term patterns for supplier {SUPPLIER}, company {COMPANY}, and {DATE_RANGE}. Show: - Supplier - Company - Invoice count - Total invoice amount - Payment terms, if available - Average days to pay, if available - Invoices paid after due date, if available

Orders

Recent Discounted Orders

Find recent orders with elevated discounts.

Use the Marquis IQ MCP server for this request. Using Marquis IQ order data, show me all orders in {DATE_RANGE} for company {COMPANY} with discounts greater than {DISCOUNT_THRESHOLD}. Include: - Order number - Order date - Customer - Company - ERP system - Item or description - Ordered quantity - List price, if available - Net price, if available - Discount percent - Extended amount - Salesperson or owner, if available Sort by discount percent descending.

Purchase Orders

PO Detail

Review purchase order activity.

Use the Marquis IQ MCP server for this request. Using Marquis IQ purchase order data, show purchase orders for {SUPPLIER_OR_CATEGORY} during {DATE_RANGE}. Include: - PO number - PO date - Supplier - Company - ERP system - Item or description - Ordered quantity - Received quantity - Open quantity - Unit price - Extended amount
Open PO Follow-Up

Find open purchase orders that may need attention.

Use the Marquis IQ MCP server for this request. Using Marquis IQ purchase order data, identify open purchase orders older than {DAYS_OLD} days for company {COMPANY}. Group by: - Supplier - Company Show: - Total open amount - Open line count Then list the top 25 oldest open PO lines with buyer, promised date, and any available receipt status.
Unit Price Change

Spot price movement for purchased items.

Use the Marquis IQ MCP server for this request. Using Marquis IQ purchase order data, find purchased items in {ITEM_OR_CATEGORY} with unit price changes of at least {MINIMUM_PERCENT_CHANGE} during {DATE_RANGE}. Include: - Item or description - Supplier - Company - ERP system - Prior unit price - Current unit price - Percent change - Purchase quantity - Extended amount impact, if available

Sales & Margin

Invoice Amount by Category

Graph AR invoice amount for an entered category, such as product category, customer, warehouse, or salesperson.

Use the Marquis IQ MCP server for this request. Using Marquis IQ AR invoice / invoiced sales data, show Invoice Amount by {BREAKDOWN} for company {COMPANY} over {DATE_RANGE}. Return: - A bar chart of Invoice Amount by {BREAKDOWN} - Limit the chart to the top {TOP_N} values, sorted descending - A small table under the chart with {BREAKDOWN}, Invoice Amount, invoice count, and percent of total - The grand total Invoice Amount Keep it simple. Do not add extra analysis unless the chart would be misleading without a short note.
Invoice Amount Trend by Category

Graph AR invoice amount over time, split by an entered category.

Use the Marquis IQ MCP server for this request. Using Marquis IQ AR invoice / invoiced sales data, show Invoice Amount over time by {BREAKDOWN} for company {COMPANY} during {DATE_RANGE}. Return: - A line or stacked bar chart of Invoice Amount by month, split by {BREAKDOWN} - Limit the series to the top {TOP_N} {BREAKDOWN} values by total Invoice Amount in the period - Group remaining values as Other if needed - A small table of monthly Invoice Amount by {BREAKDOWN} Keep it simple. Do not add extra analysis unless the trend would be misleading without a short note.
Margin Erosion

Identify parts with the largest margin erosion.

Use the Marquis IQ MCP server for this request. Using Marquis IQ sales and margin data, identify which parts have the largest margin erosion in {DATE_RANGE} versus {COMPARISON_PERIOD} as a percent of total revenue for company {COMPANY} and business segment {BUSINESS_SEGMENT}. Include: - Part number - Part description - Company - Business segment or category - Current-year revenue - Prior comparison revenue, if available - Current-year margin percent - Prior comparison margin percent, if available - Margin erosion in percentage points - Margin erosion as a percent of total revenue Sort by largest margin erosion as a percent of total revenue. Explain any assumptions used to calculate margin erosion.

Supplier Analysis

Supplier Spend

Summarize supplier activity across available datasets.

Use the Marquis IQ MCP server for this request. Using Marquis IQ, summarize spend for {SUPPLIER} over {DATE_RANGE}. Compare AP invoice total to purchase order total where both datasets are available. Break results out by: - Company - ERP system Call out any unusual spikes by month.
Supplier Concentration

Identify spend concentration by supplier.

Use the Marquis IQ MCP server for this request. Using Marquis IQ {SPEND_DATASET} data, summarize supplier concentration for company {COMPANY} over {DATE_RANGE}. Show the top {TOP_N} suppliers. Show: - Supplier - Total spend - Percent of total spend - Invoice count or PO count, depending on available data - Company - ERP system Sort by total spend descending.

Advanced Topics

Use these prompts for larger deliverables, dashboard artifacts, and workflows that require an attached image or more detailed instructions.

Generate CSV

Ask Claude to export a full dataset extract as a downloadable CSV.

Use the Marquis IQ MCP server for this request. Using Marquis IQ, export all {DATASET_NAME} records for {TIME_PERIOD} to a downloadable CSV. Include all columns and all rows. Do not apply filtering. Do not aggregate the data.

Dashboard Artifacts

Use this prompt when you want Claude to recreate a dashboard layout as an interactive HTML artifact. Attach the Tableau dashboard screenshot before sending the prompt. The sample screenshot is expected at img/mcp/mcp_sample_dashboard.png.
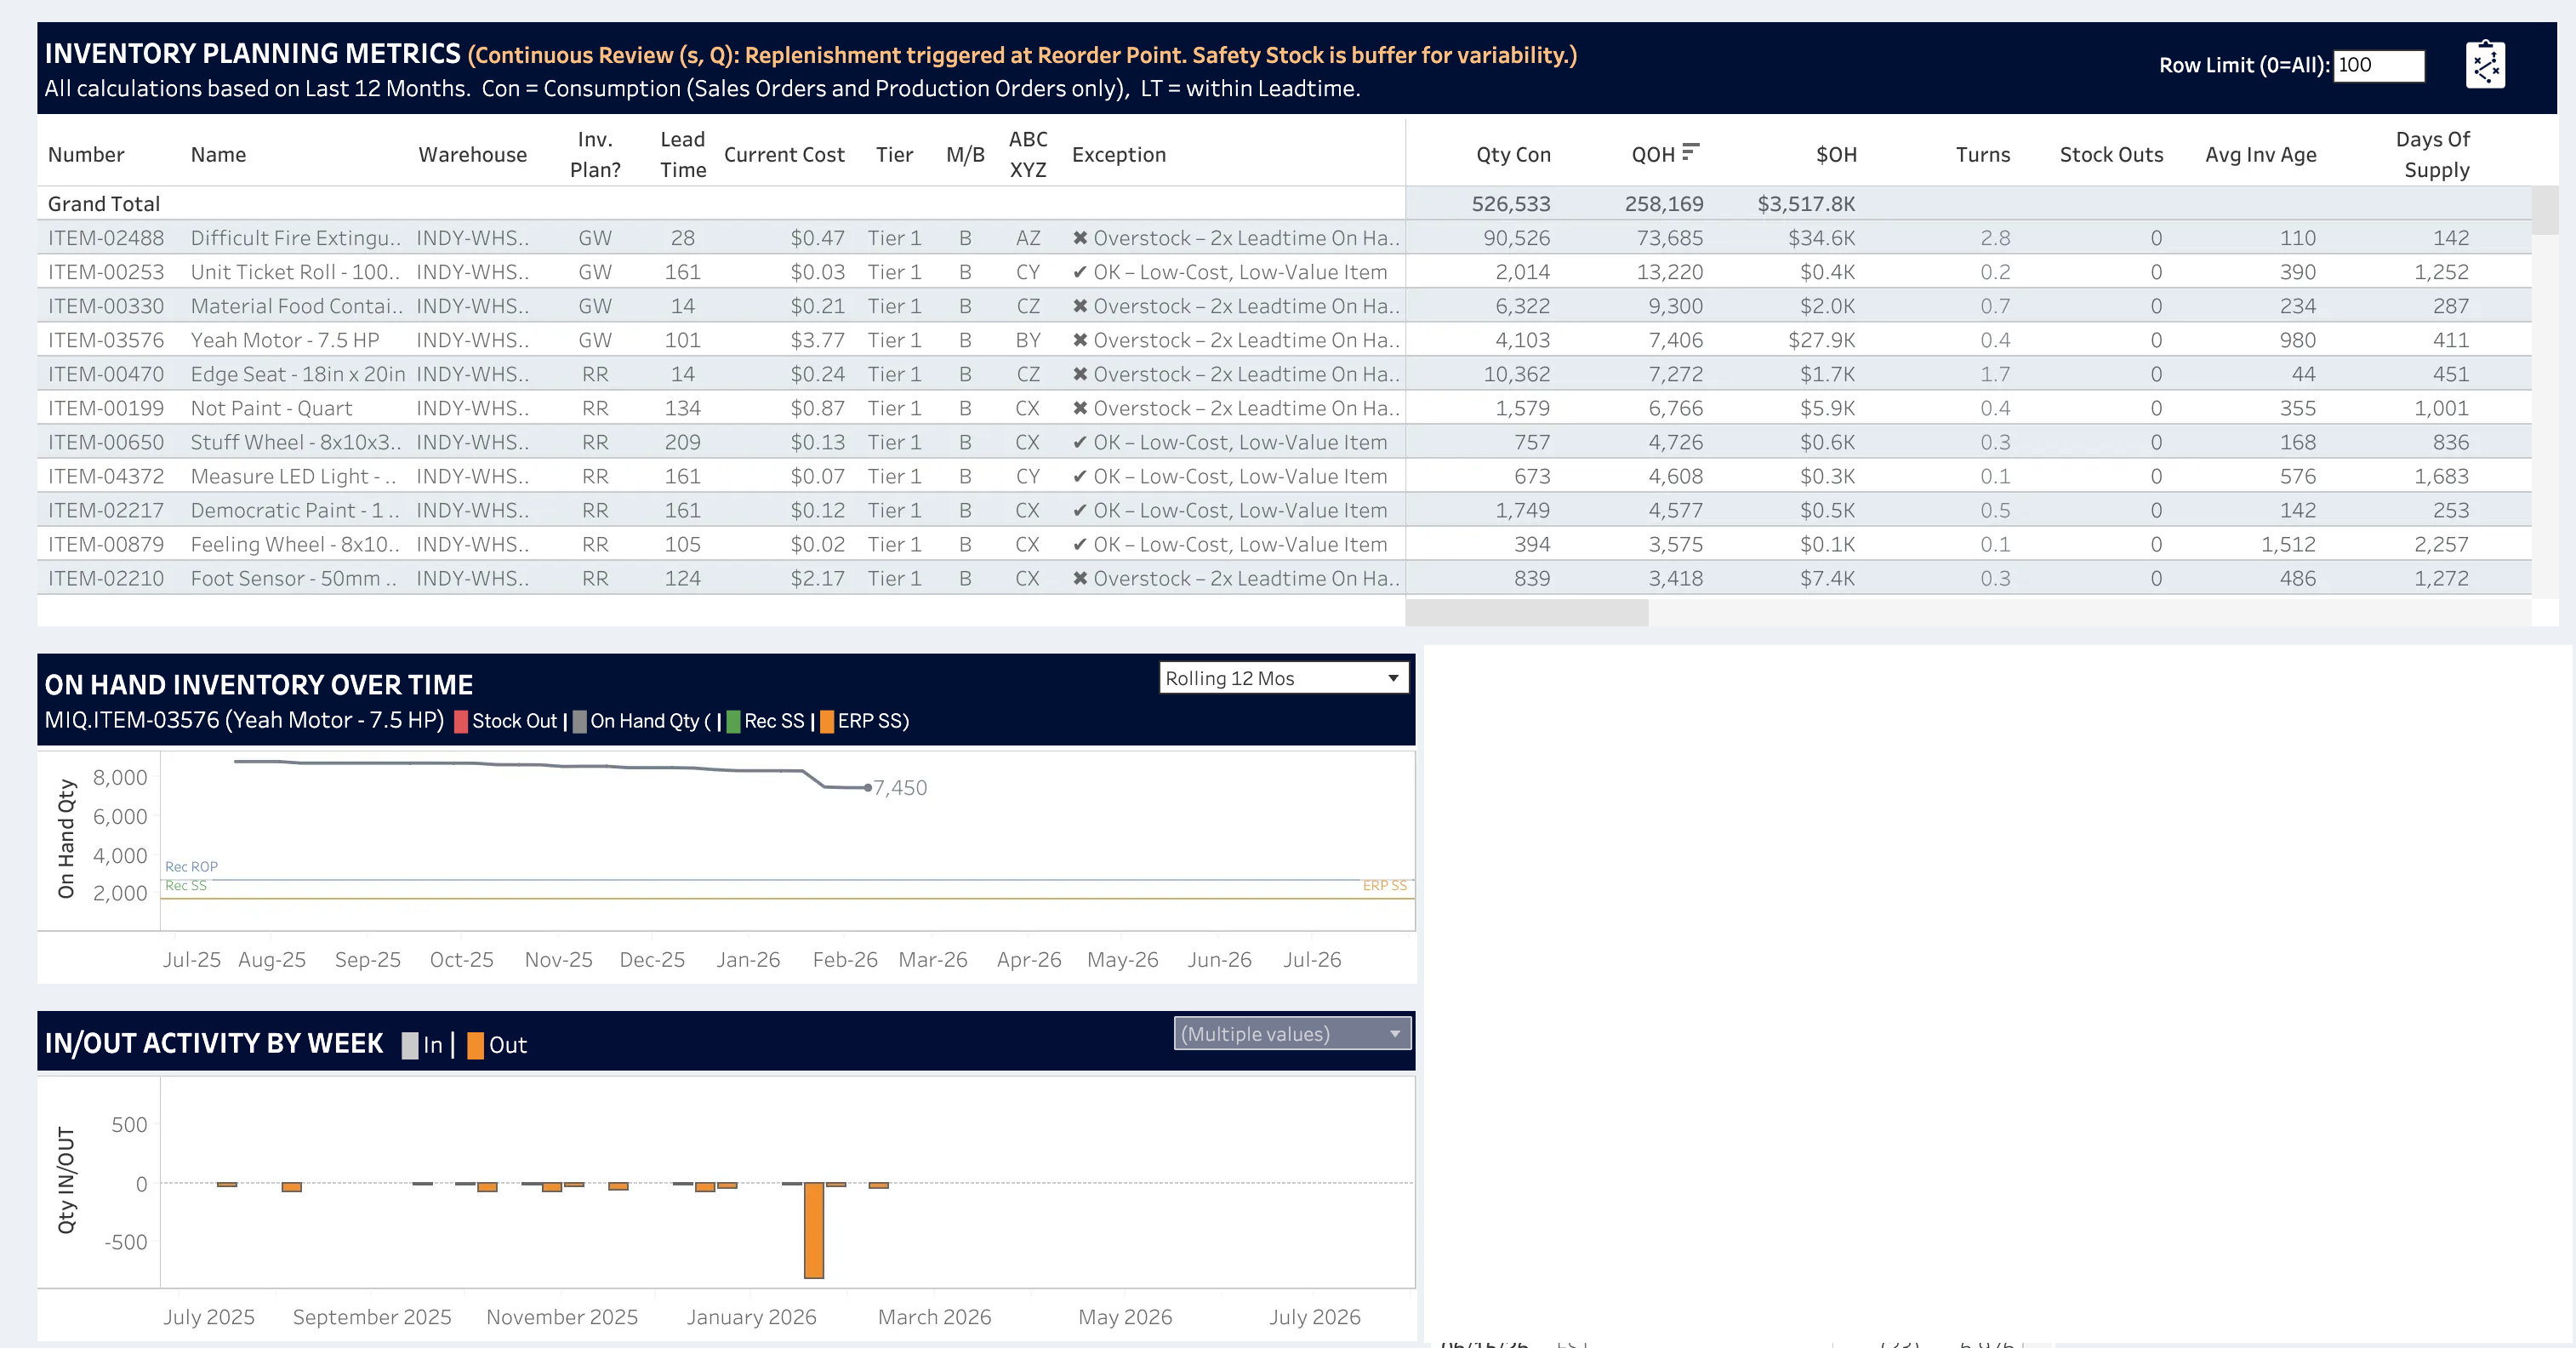
Sample Tableau inventory planning dashboard screenshot
Sample dashboard screenshot to attach when asking Claude to recreate a Tableau dashboard as an interactive artifact.
Recreate Tableau Dashboard

Ask Claude to recreate an attached Tableau dashboard screenshot as an interactive artifact.

Use the Marquis IQ MCP server for this request. Using the attached Tableau dashboard screenshot as a reference, build an interactive HTML artifact that replicates its layout and functionality as closely as possible. Requirements: - Match the overall layout, panel arrangement, color scheme, and typography from the screenshot. - Make the top data table interactive. Clicking a row should update all charts and detail panels below it. - Reproduce each chart type shown, such as line, bar, step, waterfall, or other visible chart types, using Chart.js. - Include all visible columns, metrics, labels, badges, and exception indicators from the screenshot. - Populate with the data visible in the screenshot. Use representative placeholder data for any rows or values not fully visible. - Use a dark theme if the source uses one; use a light theme if not. - Render all filters, dropdowns, and selectors shown. Make them functional where simple and cosmetic where complex. - Match the visible panel structure. If the screenshot uses a three-panel bottom layout, use the left panel for trend charts, the center panel for the detail or MRP-style table, and the right panel for the breakdown or consumption table. - Use no external dependencies beyond Chart.js from cdnjs. Data note: - Replace any placeholder data with live Marquis IQ MCP query results before sharing with end users. Deliverable: - Provide a self-contained HTML artifact. - Include concise notes explaining what data is from the screenshot, what is placeholder data, and what should be replaced with live Marquis IQ MCP results.
Tip
Good MCP prompts are specific. Include the dataset, business subject area, company, ERP system, date range, fields you want back, and how you want the results grouped or sorted.
Link copied